Projects
Berg Project
LONG LIFE, HIGH OUTPUT, OPEN PIT COPPER PROJECT
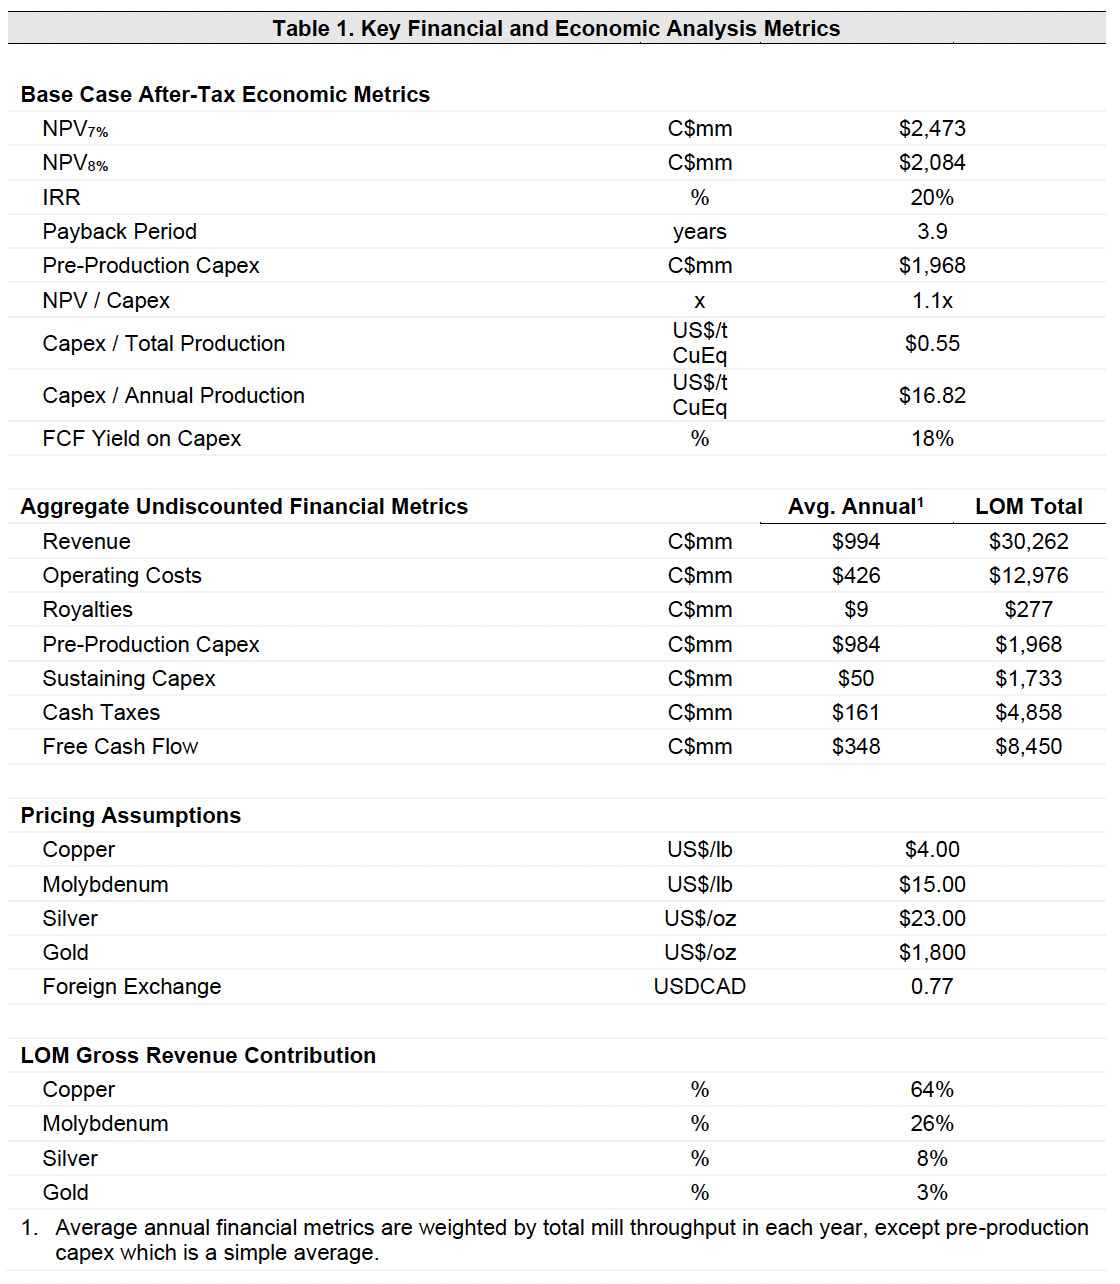
- NPV8% of C$2.1 billion
- IRR of 20%
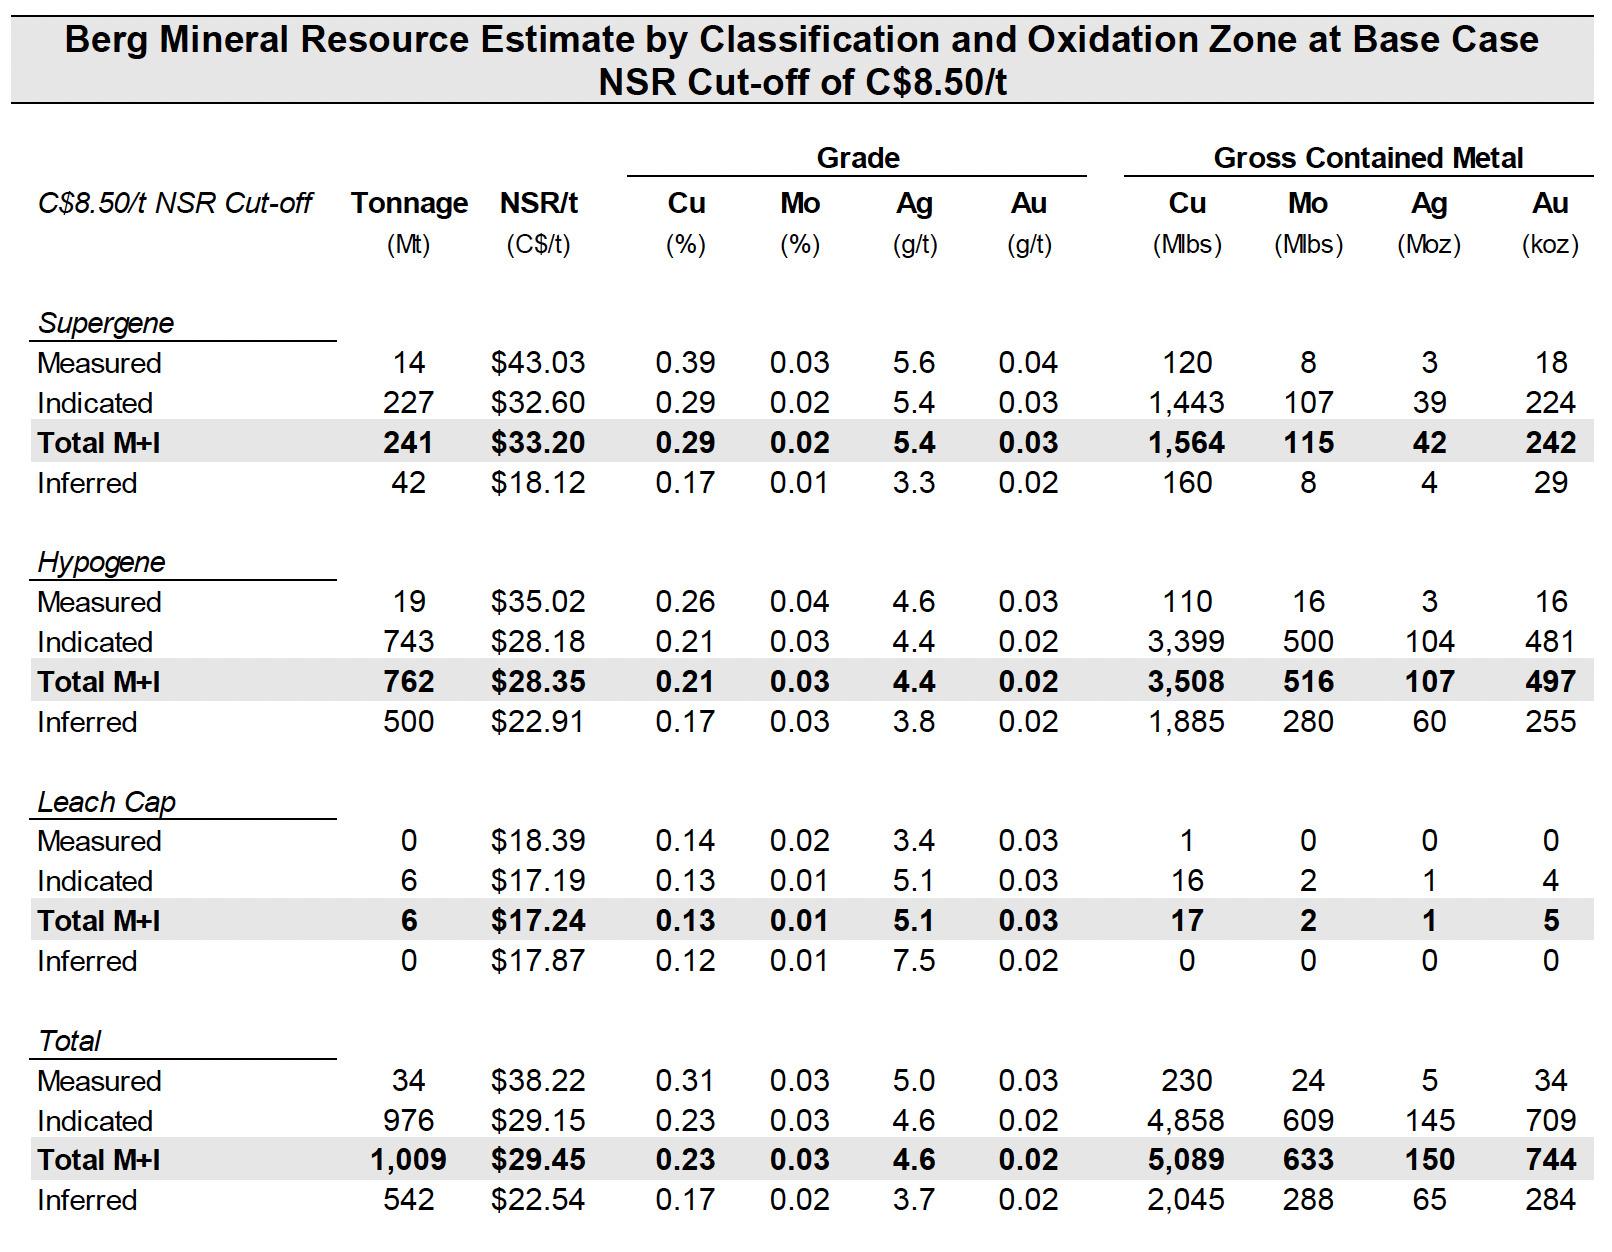
- Updated resource with more than 1.0 billion tonnes of Measured and Indicated material containing
- 5.1 billion lbs of copper,
- 633 million tonnes of molybdenum
- 150 million ozs of silver and
- 744 thousand ozs of gold
- 30 year mine life with average annual production of 191 million lbs of CuEq
- 220 million lbs CuEq over first 10 years of full production
- LOM C1 by-product cash cost of US$0.46/lb
- Low life of mine strip ratio of 1.1 inclusive of 43 million tonnes of pre-stripping
- Pre-production CAPEX of $2.0 billion, giving 1.1x NPV/CAPEX ratio
- Advancing towards Prefeasibility study with $6-8 million cost to complete
As released on June 13, 2023, the first ever publicly available economic study (PEA) for the Berg project lays out a 43-101 compliant Project plan showing a standalone Open Pit Copper Mine and concentrator facility lying within one of the largest undeveloped Copper belts in British Columbia. The project being within the traditional territory of the Wet'suwet'en First Nation and Wet'suwet'en peoples along with the Cheslatta Carrier Nation Surge looks to partner with the local communities and Nations make use of existing infrastructure such as road access and the fully hydroelectric green power grid in BC, to rapidly advance the project to the Pre-Feasibility (PFS) level of study to declare the first ever reserves for the Berg project in the near future.
UPDATED RESOURCE
65% increase in M+I tonnes, 140% increase in Total tonnes
88% increase in contained copper
54,384 metres of drilling
Located within the Tahtsa Ranges of British Columbia the Berg resource is a classic calc-alkaline Cu-Mo porphyry deposit. The MRE benefits from 2,855 metres of new drilling completed by Surge in 2021, 7,261 new gold assays collected by Surge from historical core and pulp samples during 2022 and 2023, improved geostatistical modelling of silver in the deposit, and improved metallurgical recovery assumptions based on an extensive review of historical metallurgical testwork by Ausenco and Surge.
Mineralization at the Berg deposit forms a ring around a broadly cylindrical, multi-phase intrusive stock known as the Berg Stock. The mineral resources comprise two highly fractured mineralized zones in the northeast and southern portions of the annulus. Hypogene mineralization is characterized by several generations of veining, and a well-developed supergene enrichment blanket is superimposed on the hypogene mineralization.
Notes:
- The Mineral Resource estimate has been prepared by Sue Bird, P.Eng., an independent Qualified Person.
- Resources are reported using the 2014 CIM Definition Standards and were estimated in accordance with the CIM 2019 Best Practices Guidelines.
- Mineral Resources that are not Mineral Reserves do not have demonstrated economic viability.
- The Mineral Resource has been confined by a “reasonable prospects of eventual economic extraction” pit using the following assumptions:
- Cu price of US$4.00/lb, Mo price of US$15.00/lb, Au price of US$1,800/oz, Ag price of US$23/oz at an exchange rate of 0.77 US$ per C$;
- 96.5% payable for Cu, 90.0% payable for Ag and Au, 99.0% payable for Mo, 1% unit deduction for Cu and Mo, Cu concentrate smelting of US$75/dmt, US$0.08/lb Cu refining, US$1.30/lb Mo refining, transport and offsite costs of US$100/wmt and US$130/wmt for Cu and Mo concentrates respectively, a 1.0% NSR royalty, and uses average recoveries for Cu, Mo, Ag, and Au of 82%, 70%, 66% and 55% respectively in the supergene & leach cap and of 80%, 78%, 64% and 55% respectively in the hypogene;
- Mining costs of C$2.50/tonne mineralized material, C$2.50/tonne waste;
- Processing, G&A and tailings management costs of C$8.50/tonne; and
- Pit slopes of 45 degrees.
- Numbers may not add due to rounding.
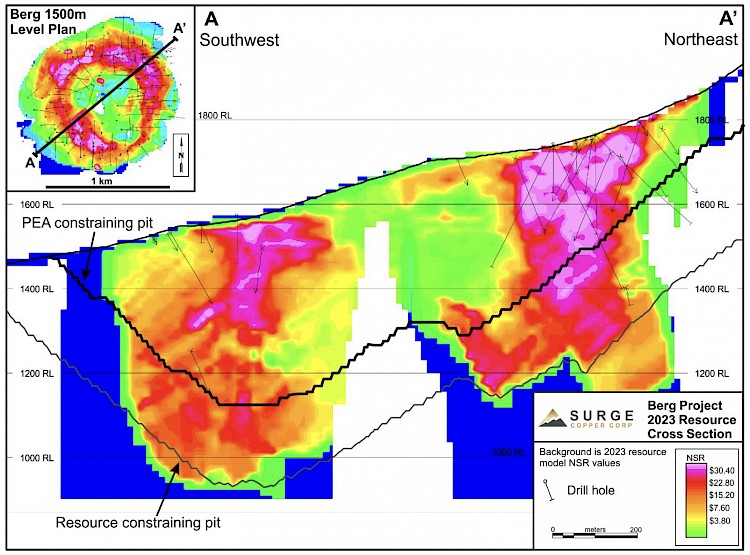
Figure. Berg Resource Cross Section Showing Resource Pit and Mineable Inventory Pit
PEA SUMMARY
Post tax NPV8% of $2.1 billion
3.9 year payback
Average Annual FCF of $348 million
30 year mine life, 978 million tonnes of Mineral Inventory
Large Economies of Scale mining and processing
Low Carbon footprint opportunity
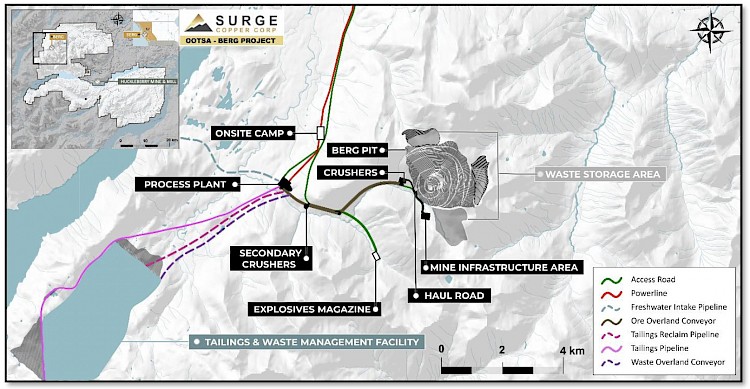
The Berg PEA outlines a long-life open pit mine with excellent economics and the ability to feed a projected growing copper market in the transition away from fossil fuels. Ideally situated to make use of BC’s green power grid and taking advantage of available electric mining technologies such as downhill conveyor systems to transport rock while generating electricity. The conventional truck and shovel operation will further make use of battery electric technologies as they are developed in time for initial production at the Berg project. The conventional crushing/grinding and flotation circuit lead to a low execution risk project development yielding the following economic results:
The PEA is preliminary in nature and includes Inferred Mineral Resources that are considered too speculative geologically to have the economic considerations applied to them that would enable them to be categorized as Mineral Reserves, and there is no certainty the PEA will be realized.
DISTRICT SCALE EXPLORATION
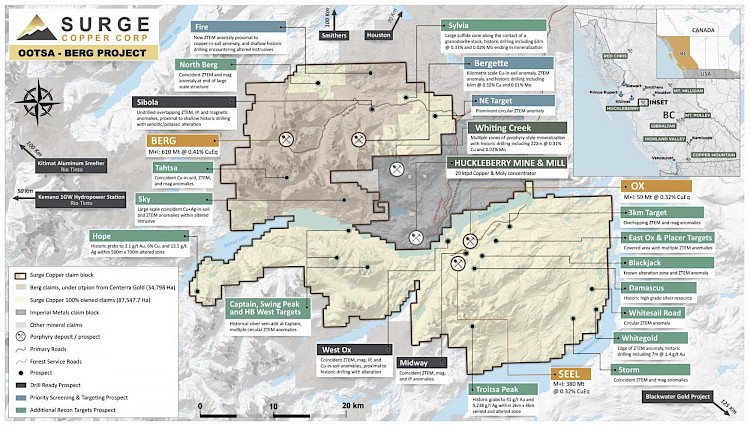
The Berg property also hosts excellent exploration opportunities. Recent work includes over 4,000 soil, 500 rock samples and 24 ground IP lines across numerous target areas. Three new drill discoveries made and significant advancement of greenfields targets. Recent results on the Bergette target highlighted:
BGT22-01: 143m @ 0.23% Cu, 0.010% Mo, and 0.03 g/t Au from 3m depth
BGT22-02: 176m @ 0.22% Cu, 0.012% Mo, and 0.03 g/t Au from 8m depth
Disclaimer
Dr. Shane Ebert P.Geo., is the Qualified Person for the Ootsa and Berg projects as defined by National Instrument 43-101 and has approved the technical disclosure contained in this news release.

